Pull up three different home search sites this week and search the same six blocks above Dolores Park. One will tell you the median list price is just over $2 million. Another will show a median sale price near $2.7 million, up 50 percent from a year earlier. A third will quote something closer to $1.8 million, down 9 percent over the same stretch. Same neighborhood, same month, three numbers that don't just differ. They tell three different stories about which direction the market is moving.
None of the sites made an error. They're each measuring something real. The problem is that almost none of them are measuring Dolores Heights.
A neighborhood that mostly gets counted as somewhere else
San Francisco's MLS divides the city into numbered districts for reporting purposes, and Dolores Heights sits inside District 5, the Central district. District 5 is not a tight boundary around Liberty Hill and the streets that ring the park. It bundles together roughly a dozen distinct neighborhoods: Noe Valley, Eureka Valley and the Castro, Cole Valley, Glen Park, Corona Heights, Clarendon Heights, Ashbury Heights, Buena Vista Park, Haight Ashbury, Duboce Triangle, Twin Peaks, Mission Dolores, and Parnassus Heights, with Dolores Heights folded in as one small piece of a much larger area.
When a national search site reports a "Dolores Heights median," it is usually reporting District 5 data, adjusted or unadjusted, because that's the level at which the MLS actually tracks transactions. A hillside lot on Liberty Street and a two-bedroom flat near Cole Valley's commercial strip get averaged into the same figure, even though they have almost nothing in common except a shared MLS code.
That alone explains part of the spread between sites. It does not explain all of it. The rest comes down to what each site is actually counting.
Three numbers, three different questions
Here's what the discrepancy looks like when you line the figures up side by side, along with the window each one covers.
| Source type | What it measures | Time window | Headline figure |
|---|---|---|---|
| National valuation site | Median list price, active listings | August 2026 | $2.02 million |
| Aggregator sales chart | Median sale price, closed transactions | March 2026 | $2.7 million, up 50% year over year |
| Combined-zone portal | Median sale price, trailing 12 months, "Eureka Valley-Dolores Heights" grouping | Ending mid-2026 | $1.825 million, down 9% year over year |
The first number is a snapshot of what sellers are asking right now. The second is what buyers actually paid in a single closing month, which in a district this thin can swing wildly based on one or two high-end sales. The third rolls twelve months together and uses a slightly different neighborhood boundary than either of the other two, one that merges Eureka Valley and Dolores Heights into a single reporting zone rather than treating them separately.
List price versus sale price. One month versus twelve. One boundary versus another. Stack those three variables on top of a district that already blends a dozen neighborhoods together, and you get exactly the kind of noise a reader sees when comparing sites side by side. It isn't that the market is chaotic. It's that "Dolores Heights" as a data category barely exists.
What the actual neighborhood looks like when you count it
The real footprint is small enough to count by hand. At the end of the third quarter of 2025, one local market summary put total active inventory at 9 single-family homes and 12 condos for the entire neighborhood, working out to roughly 1.4 months of supply. As of this writing, the major listing platforms show active inventory still sitting in the low dozens. That is not a data sample large enough to produce a stable median from month to month. A single high-value closing, or a single distressed one, moves the number more than it would in a district with hundreds of annual sales.
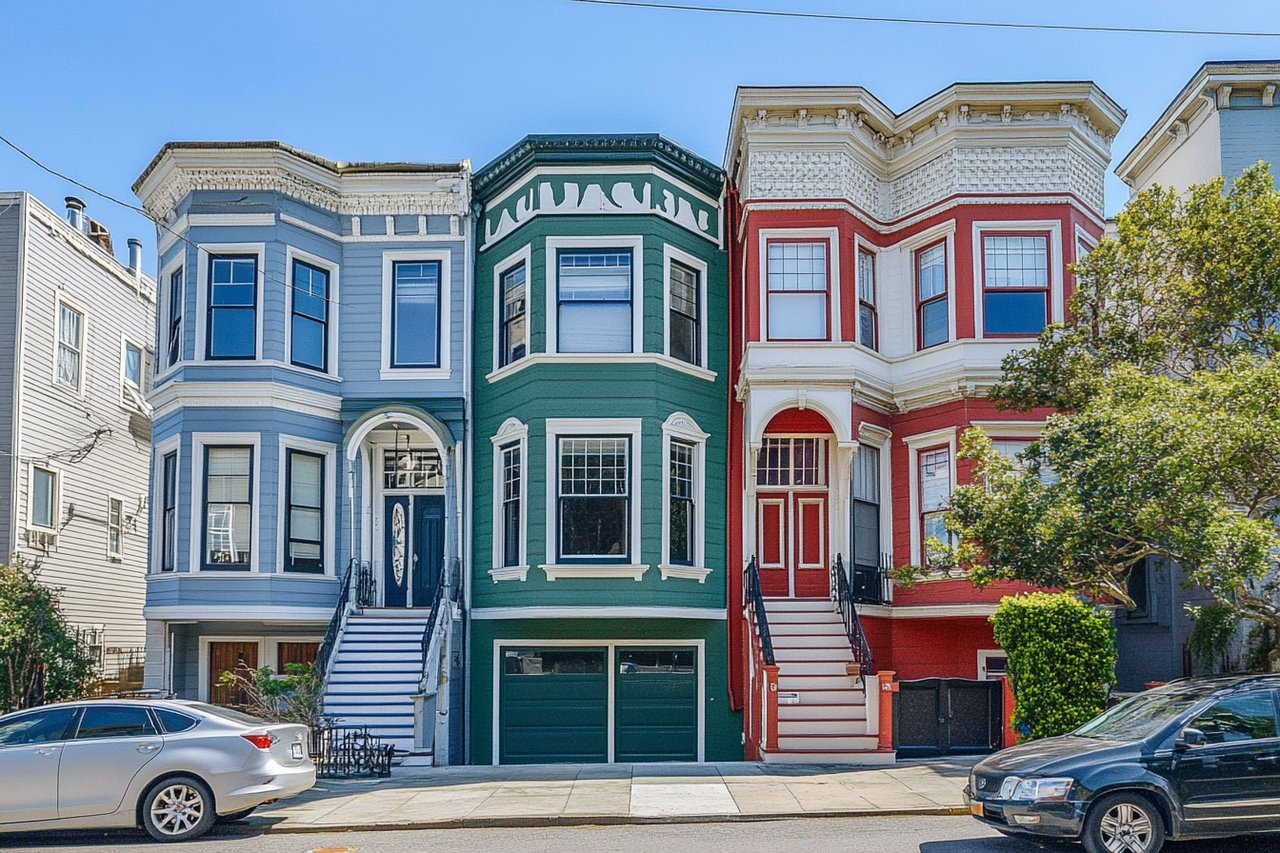
This is also a neighborhood where the housing stock resists easy averaging on its own terms. The core sits inside the Liberty Hill Historic District, a compact grid of Victorian and Edwardian buildings on streets steep enough that stairway walkers list Dolores Heights alongside Telegraph Hill and Russian Hill as one of the city's defining hidden-stairway neighborhoods. Recent inventory here has ranged from Edwardian flats one block from Dolores Park to a fully entitled ground-up project designed by Marmol Radziner, the same architecture firm known for high-profile modern residential work in California. A five-story custom estate and a two-bedroom Edwardian flat do not belong in the same median any more than Cole Valley and Liberty Street do.
What this means if you're pricing a home here
If you're preparing to sell in Dolores Heights, the district-level median is close to useless for setting a list price. The comparable sales that matter are the handful within a few blocks of your address, not the blended figure a search site pulls for the whole MLS zone. Because inventory is this thin, an agent building your comp set needs to look at actual closed transactions on Liberty, Noe, Sanchez, and Castro streets between 18th and 22nd, not a chart labeled District 5.
Walkable proximity matters here in a way a median can't capture. Homes within a few blocks of 18th Street, close to Bi-Rite and the walk down toward Valencia Street's restaurant corridor, tend to draw different buyer interest than homes higher up the hill where the draw is view and privacy rather than street life. The J-Church line stops at the top of the park, which matters for buyers weighing car-free access against a steep walk home. None of that shows up in a district average.
What this means if you're shopping the neighborhood
If you're comparing Dolores Heights to Noe Valley or the Castro using the numbers a search site hands you, you're comparing apples that were counted by three different scales. Ask any agent showing you a property here for the actual closed sales on that block or the next one, not the district median, and ask whether the figure they're quoting reflects list price or sale price, and over what window. Given how few homes trade here in a given quarter, one recent sale on the right block will tell you more than any citywide chart.
FAQ
Why does Dolores Heights get grouped with so many other neighborhoods in market data? The San Francisco MLS reports transactions by numbered district rather than by informal neighborhood name. District 5 covers a wide swath of central San Francisco, and Dolores Heights is one of roughly a dozen areas folded into it, alongside places like Noe Valley, the Castro, Twin Peaks, and Haight Ashbury.
How many homes actually sell in Dolores Heights in a given year? The footprint is small. A recent quarter-end count showed only 9 single-family homes and 12 condos active in the entire neighborhood, and current listing counts remain in the low dozens. With that few transactions, a single unusual sale can shift a reported median more than it would in a larger district.
Is Dolores Heights part of the Liberty Hill Historic District? The core of Dolores Heights sits within the Liberty Hill Historic District, a designation covering much of the Victorian and Edwardian housing stock closest to Dolores Park.
Should I trust the median price I see on a home search site? Treat it as a starting point for the broader district rather than a number specific to Dolores Heights. For a neighborhood this small, a hand-built comp set from recent closed sales on the actual block will tell you more than any aggregated figure.
If you're weighing a purchase or a sale on Liberty Street, Noe Street, or anywhere in the six blocks around Dolores Park, the district median won't get you there. Deason Group works this neighborhood block by block, and we're glad to walk you through the actual comps behind the headline number. Contact us when you're ready to talk specifics.